
If you ride mountain passes long enough, the question is no longer if you’ll ride again, but which one. And that’s exactly where the problem begins.
Performance isn’t everything in cycling.
Climbing - as we call it - has something mystical to it. Almost ritualistic.
Up in the mountains, while your breathing gets heavier and your cadence slower, you can slip into altered states. Some say it’s just oxygen deprivation. But hey, the high is kind of nice.
The mountains are also a bit like forests:
In Japan, they have a concept for this: Shinrin Yoku, or forest bathing.
It’s the art of immersing yourself in nature with all senses. Not as a workout, but as therapy.
That’s exactly what climbing does. Cycling is a tool of awareness.
But before we talk about epic climbs and becoming some sort of monk,
let’s start with the most basic question:
What exactly is a pass?
The messy truth behind beautiful roads
Most cyclists have a gut feeling for what counts as a real pass. But try to define it, and things get a bit fuzzy:
- Is it about the altitude?
- The number of switchbacks?
- Does it have to cross a canton? A border?
- Do we need to see some snow, even in summer?
- And does it still count if the top isn’t really a “peak”, but more like a soggy meadow with a bus stop?
Turns out: There are definitions. But they’re blurry.
The one I chose (for this project at least) goes something like this:
A pass road is a rideable route that crosses a mountain ridge at its lowest practical point and connects two valleys.
In other words: It’s not about how high you climb, but where you cross.
And there’s a deeper explanation behind it.
When you cross a pass, you don’t just change valleys. You also cross watersheds, language regions, cultural peculiarities, and micro-climates. And sometimes, the cheese tastes completely different.
So crossing a pass has something of an initiation rite with the topology you’re moving through. What defines a pass is less about altitude, and more about function and transformation.
Let’s define: The label “Pass” isn’t tied to a specific height.
It’s not about numbers. It’s about crossing, connection, terrain – and cultural as well as mental expansion.
So with that in mind, I began digging.
Scraping for clarity
I quickly found a cohesive and regularly updated list provided by the Swiss Touring Club (TCS) - a solid collection of 77 key mountain passes.
To extract the data, I wrote a custom scraper using Python and BeautifulSoup.
It crawled through the page structure and pulled in names, altitudes, routes, distances, and metadata like gradient, winter status, and whether there’s a restaurant or an EV charging station at the top.
I won’t publish the full scraper here, but the idea is simple:
- Open the saved HTML file
- Loop through each pass block
- Parse and clean the relevant fields
- Export everything to a CSV file for further analysis
That’s it.

Cleaning and arranging
The raw list was almost perfect, but still needed a bit of cleaning.
I used Excel formulas like =TRIM(CLEAN(B2)) to get rid of weird spacing or invisible characters. Some fields were merged and had to be split using Power Query.
I also had to standardize all numerical values:
Distances, gradients, and altitudes were converted into float format, because Python treats numbers differently based on their type.
A string is just a piece of text. Even if it looks like a number.
For example, "8,5" (with a comma) is not a valid number in Python, it’s treated as a string because of the comma instead of a dot, which Python doesn’t recognize as a decimal separator.
So while "8,5" might mean eight point five to a human, to Python it’s just a text label, like "apple" or "hello".
To use it in calculations, it first has to be cleaned and converted into a proper number format, like 8.5.
So before I could analyze anything, I had to replace commas with dots (8,5 → 8.5) and drop anything that couldn’t be converted cleanly.
It’s a small step. But without it, you’re basically comparing apples and strings. And funny enough, this was one of the first things I learned when starting with Python.
After cleaning and exporting the data, I loaded it into a simple table and started checking for outliers. One or two passes had gradients over 25% – which didn’t feel right. Some had distances of “99 km” that were clearly a typo. Where necessary, I fixed them manually.
From table (csv) to terrain (gpx)
Once the cleaned CSV was ready, I moved on to the next step:
building every route manually in Komoot.
I’ve built hundreds of GPS tracks over the years, and I pay a lot of attention to clean route design.
My routes always take multiple parameters into consideration.
Especially when planning off-road (which wasn’t the case here), I usually incorporate practical tweaks, like avoiding traffic-heavy roads, passing through supermarkets or gas stations to refill calories, and choosing more scenic alternatives when available.
So with that background, I followed a few simple rules for the mountain pass set:
-
First, I hand-picked 50 out of the 77 passes provided in the dataset. Mostly the highest and most iconic ones.
-
If a route went through long tunnels or busy highways, I picked the alternative - usually a quieter, paved road. Because beauty and safety matter.
-
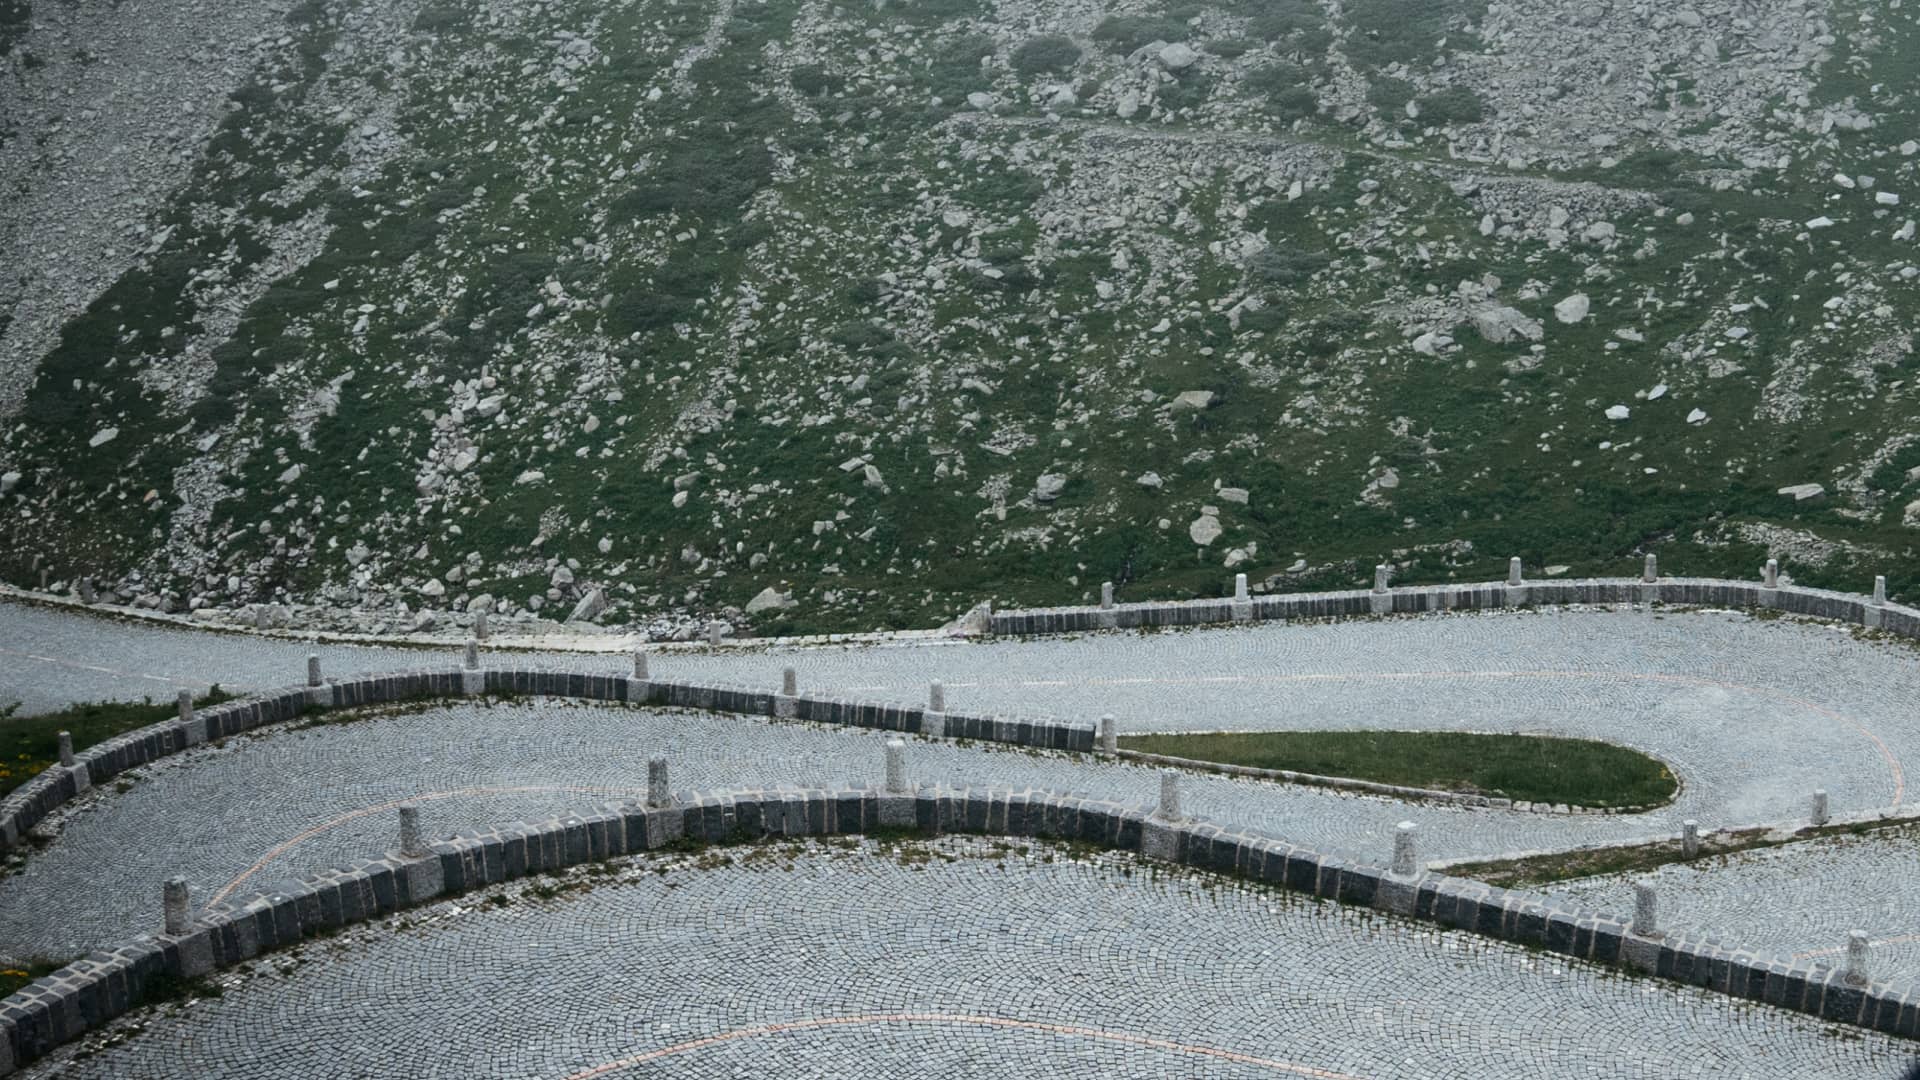
If there was a classic segment - like the old north ramp at Gotthard, a historic cobbled postal road - I chose that for full authenticity.
-
I tried to connect the routes from train station to train station, or church to church, or bridge to bridge - to give them a sense of cohesion. A kind of narrative logic.
It took a while. 😅 But in the end, every route had a soul.
Building a GPX-Stats-Extractor
While the original TCS data gave a good overview to start building in Komoot,
the dataset had to be updated with the real distance and the actual elevation gain.
Therefore, I built a Jupyter Notebook called “GPX Stats Extractor.”
Loading Libraries:
import os
import csv
import glob
import gpxpy
from geopy.distance import geodesic

# Checking if all the libraries imported successfully or not
print("Imported Successfully!")
Analyze a single GPX file and extract elevation, distance & gradients:
def analyze_gpx_track(gpx_file):

    with open(gpx_file, 'r', encoding='utf-8') as f:
        gpx = gpxpy.parse(f)

    filename = os.path.basename(gpx_file)
    points = []

    for track in gpx.tracks:
        for segment in track.segments:
            for point in segment.points:
                if point.elevation is not None:
                    points.append((point.latitude, point.longitude, point.elevation))

    if not points:
        print(f"No elevation data in {filename}")
        return {
            'name': filename,
            'elevation': None,
            'distance': None,
            'max_grade': None,
            'avg_grade': None
        }

    elevations = [p[2] for p in points]
    highest_elevation = max(elevations)

    total_distance_km = 0
    gradients = []

    for i in range(1, len(points)):
        p1 = (points[i-1][0], points[i-1][1])
        p2 = (points[i][0], points[i][1])

        dist_km = geodesic(p1, p2).kilometers
        dist_m = dist_km * 1000

        if dist_m < 1:
            continue

        total_distance_km += dist_km
        elevation_diff = points[i][2] - points[i-1][2]

        if dist_m >= 5:
            grade = (elevation_diff / dist_m) * 100
            if abs(grade) <= 30:
                gradients.append(grade)

    uphill = [g for g in gradients if g > 0]
    max_grade = max(uphill) if uphill else 0
    avg_grade = sum(uphill) / len(uphill) if uphill else 0

    return {
        'name': filename,
        'elevation': round(highest_elevation, 1),
        'distance': round(total_distance_km, 2),
        'max_grade': round(max_grade, 1),
        'avg_grade': round(avg_grade, 1)
    }
Analyze all GPX files in a folder and export results to CSV:
def analyze_all_gpx_files(folder):

    results = []
    files = glob.glob(os.path.join(folder, '*.gpx'))

    for file in files:
        print(f"🔍 Analyzing: {os.path.basename(file)}")
        try:
            result = analyze_gpx_track(file)
            results.append(result)
        except Exception as e:
            print(f"Error in {file}: {e}")

    output_file = os.path.join(folder, 'track_analysis.csv')

    with open(output_file, 'w', newline='', encoding='utf-8-sig') as f:
        writer = csv.writer(f, delimiter=';', quoting=csv.QUOTE_MINIMAL)
        writer.writerow(['File', 'Highest Point (m)', 'Distance (km)', 'Max Grade (%)', 'Avg Grade (%)'])

        for entry in results:
            writer.writerow([
                entry['name'],
                entry['elevation'] if entry['elevation'] is not None else '',
                entry['distance'] if entry['distance'] is not None else '',
                entry['max_grade'] if entry['max_grade'] is not None else '',
                entry['avg_grade'] if entry['avg_grade'] is not None else ''
            ])

    print(f"\n Analysis complete – File saved: {output_file}")
Trigger the analysis with the local GPX folder path:
folder_path = r"folder\gpx"
analyze_all_gpx_files(folder_path)
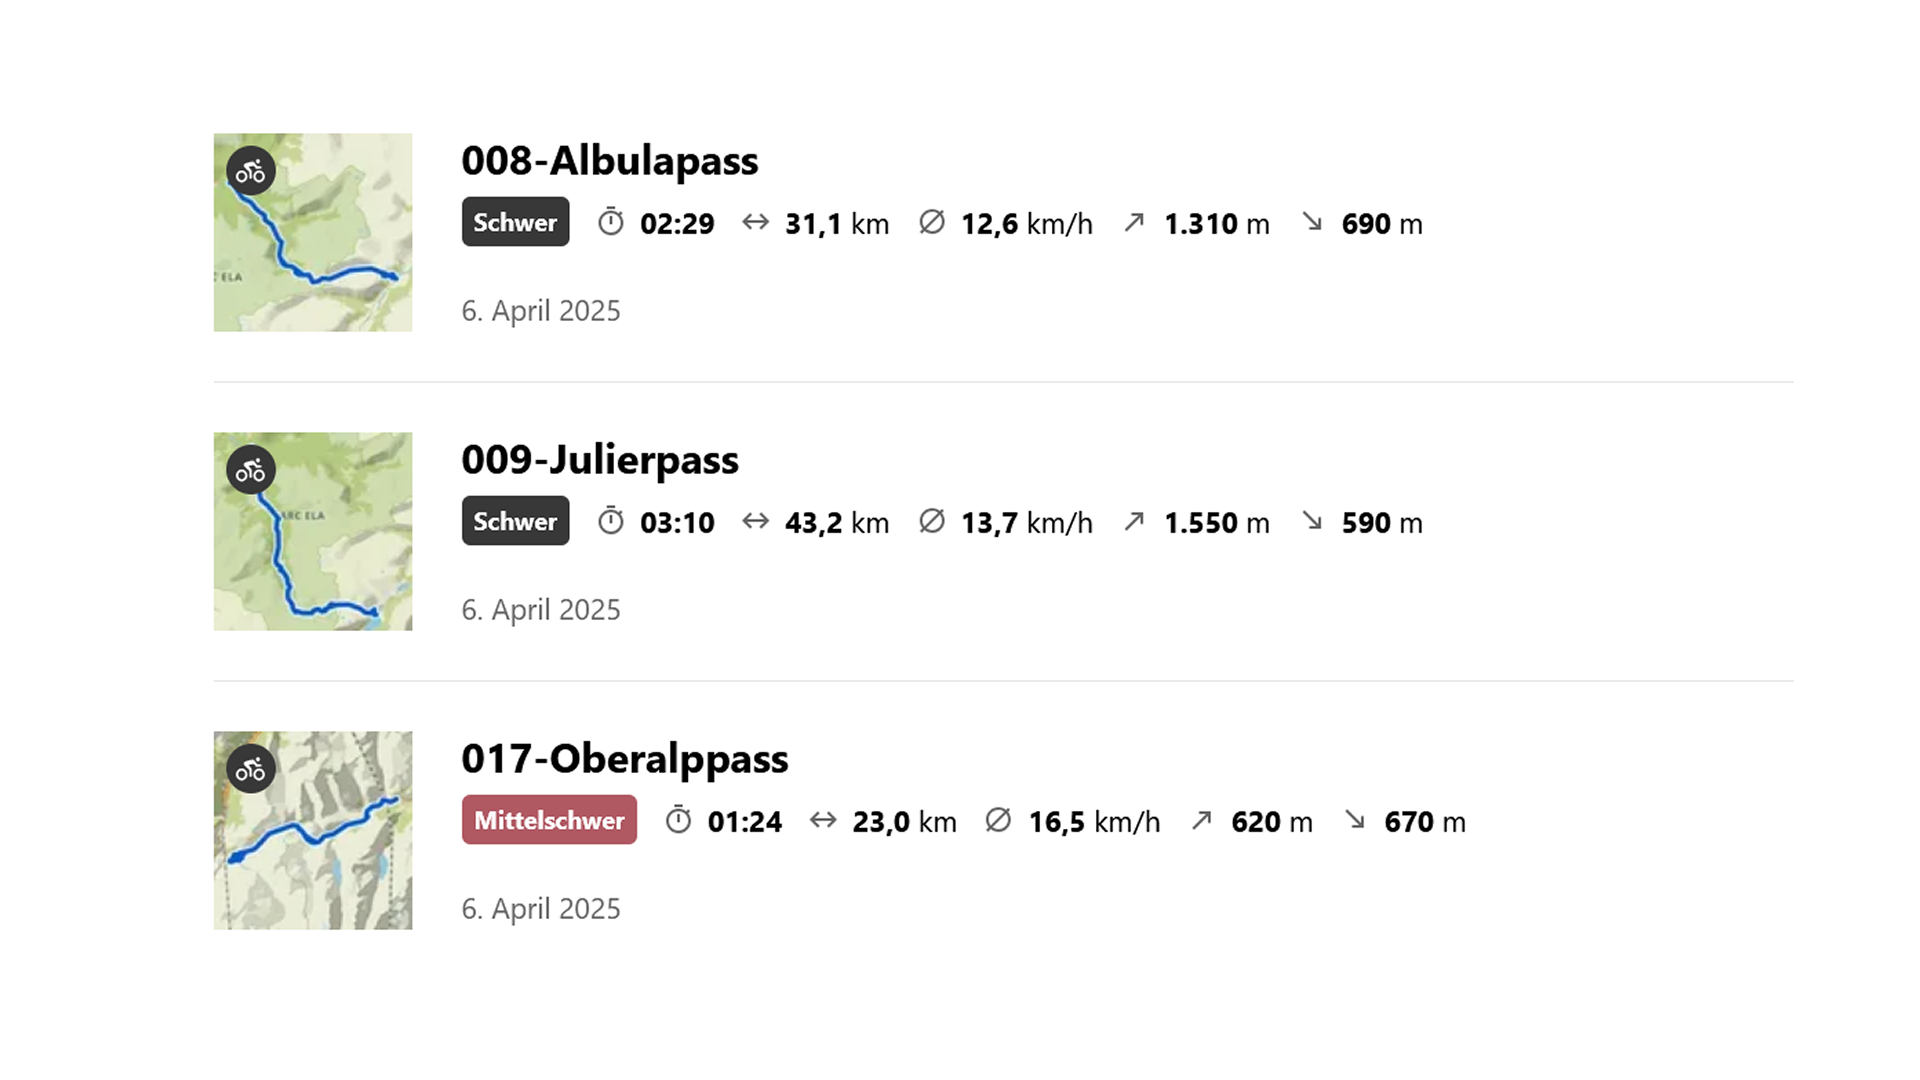
Once those values were extracted from the GPX files, the table was ready for visualization.

In the next post, I’ll take you through the first visualizations –
and show what data can reveal when you look at mountains not just with legs, but with code.